Define the time series before calculating a rate
Backlink velocity can refer to new links published, records newly discovered by a provider or net change in an inventory. Name the measure and time interval. Save the provider, target, filters, counting unit and UTC observation dates with each snapshot. A domain report and a single-page report are not successive measurements of the same population. This fictional case uses observation records, not a census of physical anchors or a ranking forecast.
Keep discovery dates separate from publication evidence
The Semrush Backlinks report describes first-seen and last-seen fields. They describe the provider’s observations; they do not necessarily date the source’s original publication. Its collection documentation also distinguishes the index and update process. A discovery surge can contain older references newly encountered by the collector.
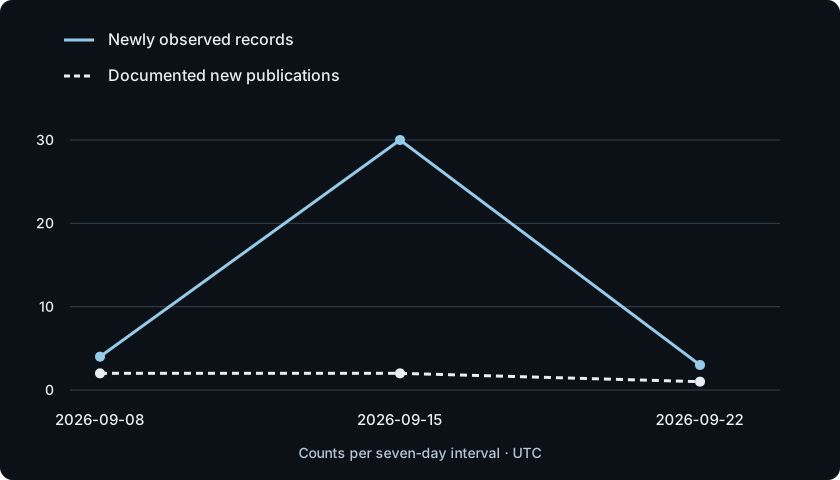
The chart compares new observed records with new publications documented separately in the fictional case log. It covers three equal seven-day intervals with the same full-site scope. No live API or publisher was queried. An unknown publication date remains unknown rather than becoming an old link or a new publication.
Follow six snapshots and one scope break
The 2026-09-01 baseline contains 100 records. The next snapshot adds four and loses one from the observed set, reaching 103; only two additions have separately documented new publication dates. On 09-15, thirty additions and two missing records produce a stock of 131. The case log identifies two new publications and 28 older references newly discovered. The spike is therefore not evidence of thirty newly published links.
On 09-22, three additions and five missing records bring the total to 129. One missing reference has a confirmed removal and four have access gaps in the case notes. On 09-29, the target changes to the planner page alone: its 50 records form a new baseline. Do not subtract 129 from 50. On 10-06, four additions and two missing records yield 52 within that page scope; one new publication is dated and three dates remain unknown.
| Check | Fictional evidence | Interpretation | Next action |
|---|---|---|---|
| 2026-09-01 | Full-site stock: 100 | Initial baseline; changes unknown | Retain scope and unit |
| 2026-09-08 | 4 added; 1 missing; stock 103 | Net 3; 2 new publications; 2 older references | Missing reference remains unverified |
| 2026-09-15 | 30 added; 2 missing; stock 131 | Net 28; 2 new publications; 28 older references | Explain the discovery spike |
| 2026-09-22 | 3 added; 5 missing; stock 129 | Net −2; 1 new publication; 2 older references | 1 confirmed removal; 4 access gaps |
| 2026-09-29 | Planner-page stock: 50 | Scope changes; a new baseline | Do not compare with the preceding 129 |
| 2026-10-06 | 4 added; 2 missing; page stock 52 | Net 2; 1 new publication; 3 unknown dates | Preserve unknowns; 2 missing unverified |
Calculate comparable changes and investigate missing records
Within a consistent scope, ending stock equals starting stock plus observed additions minus records missing from the next snapshot. Net change on 09-15 is 30 − 2 = 28. Thirty appearances over seven days average about 4.29 per day, while the net rate is 4 per day. These averages do not establish a uniform daily pattern, actual publication speed or a safe link-building schedule.
Ahrefs documents several reasons for lost links, including crawl and index changes as well as removal. A row missing from an export is not by itself a confirmed deletion. Retain the provider label, current page check and unresolved access status separately. In real data, aggregation changes can also break reconciliation; investigate instead of forcing the arithmetic.
Use the timeline and review sheet together
Download the six snapshots with their scope, UTC dates, additions, missing records, net change, documented new publications and unknown publication counts. Blank numeric cells mean no comparable measurement, not zero. The chart displays only the three comparable full-site intervals; it omits the new single-page baseline. The completed and blank review sheets help record your own decisions.
This timeline is a separate exercise from the nine-record automation and diversity input. Do not try to derive its 100-record baseline from that CSV. For your own reports, preserve snapshots and a separate publication-evidence log, compare equal units over the actual elapsed time, and start a new series whenever the target or filters change.
Download the completed review · Download the blank review · Download the six dated snapshots
Explain the event without inventing a ranking cause
A defensible summary is that the provider newly observed thirty records, with two documented new publications and 28 older references in this case. It is not that thirty new links caused a ranking change. Report missing records and their unresolved checks alongside the additions. This guide provides no universal safe velocity, penalty threshold or guaranteed acquisition rate. Known-URL monitoring, complete discovery and search-performance analysis remain separate tasks.